

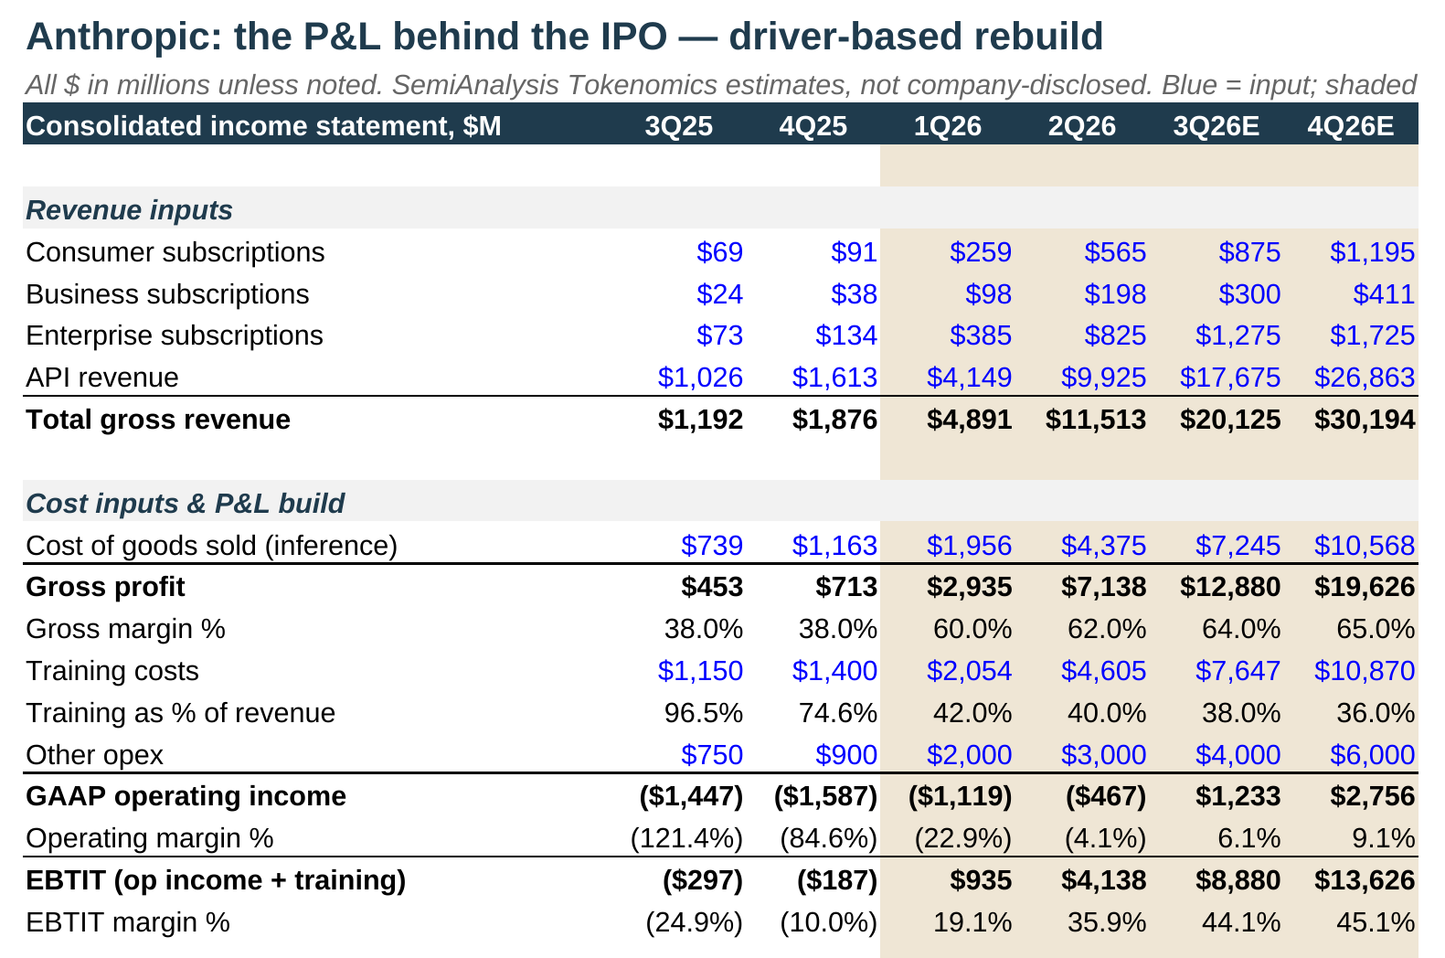
The most-debated chart of the Anthropic IPO run-up — rebuilt as a live, driver-based Excel model.
Anthropic filed its confidential S-1 on June 1, 2026, and no public financials exist yet. This template reconstructs the SPEAR Invest / SemiAnalysis Tokenomics estimates of Anthropic's quarterly P&L from 1Q24 through 4Q26E — not as a static picture of the chart, but as a working model where every output is a formula you can flex.
What's inside:
- Quarterly income statement build — four revenue lines (Consumer, Business, Enterprise subscriptions + API), inference COGS, training costs, and opex, with gross profit, GAAP operating income, and margins as live formulas
- Per-token economics engine — implied token volume, inference cost per million tokens, and EBIT per million tokens, derived exactly as the source model derives them
- EBTIT analysis — SemiAnalysis's "Earnings Before Training, Interest & Taxes" metric, showing training spend falling from 400%+ of revenue to ~36% by 4Q26E
- Scenario-ready inputs — change any blue cell (revenue per M tokens, inference cost, training spend) and the full P&L, margins, and token economics reflow instantly
- Method & Notes tab — the three investment theses from the source analysis, key caveats, and a full color legend
- Sources & Corroboration tab — every major claim mapped against the public record (WSJ, CNBC, TechCrunch, SemiAnalysis) with dates and links
All figures are third-party estimates (SemiAnalysis Tokenomics Model), not company-disclosed financials. Nothing here is investment advice.